Novo Nordisk
Geplaatst: 11 juli 2016, 08:00
Dit aandeel is reeds aan bod gekomen in de draad van gpv1 met zijn 'Global Leaders' portefeuille. Niet omdat dit er in zou zitten, maar vanwege dat Coca Cola daar wel in zit en dat is nu niet bepaald de meest gezonde drank: bij overmatig gebruik een dikmaker en hogere kans op diabetes.
Novo Nordisk op de Deense beurs - het noteert bijv. ook in de VS - is sinds de dag van de Brexit met 15% gestegen. Een pak meer dan andere aandelen. Het is de marktleider in bestrijding van diabetes. Dat is ook de kernactiviteit ervan.
Hier de cijfers zelf van het aandeel (van de WSJ, dus in USD):
http://quotes.wsj.com/NVO/financials
Valuation
P/E Ratio (TTM) 27.49
P/E Ratio (including extraordinary items) 27.19
Price to Sales Ratio 9.55
Price to Book Ratio 21.69
Price to Cash Flow Ratio 26.92
Enterprise Value to EBITDA 18.36
Enterprise Value to Sales 8.16
Total Debt to Enterprise Value 0.00
Total Debt to EBITDA 0.02
EPS (recurring) 15.08
EPS (basic) 13.56
EPS (diluted) 13.52
Efficiency
Revenue/Employee 2,655,815
Income Per Employee 857,818
Receivables Turnover 5.64
Total Asset Turnover 1.28
Liquidity
Current Ratio 1.35
Quick Ratio 1.04
Cash Ratio 0.51
Profitability
Gross Margin +84.55
Operating Margin +42.87
Pretax Margin +40.28
Net Margin +32.30
Return on Assets 41.29
Return on Equity 79.90
Return on Total Capital 78.29
Return on Invested Capital 79.90
Capital Structure
Total Debt to Total Equity 2.28
Total Debt to Total Capital 2.23
Total Debt to Total Assets 1.17
Interest Coverage 312.62
Long-Term Debt to Equity -
Long-Term Debt to Total Capital -
Long-Term Debt to Assets -
Per Share Data Novo Nordisk A/S ADR
All values updated annually at fiscal year end
Earnings Per Share +13.56 Sales 41.87
Tangible Book Value 17.59 Operating Profit 17.95
Working Capital 5.60 Long Term Liabilities 1.55
Capital Expenditure 2.49 Capital Expenditure TTM 2.18

@Umi, bedankt voor de info die me dit deed uitzoeken.
Iemand een oordeel? Ziet er voor mij persoonlijk een zeer duur aandeel uit, maar met volop potentieel.
Novo Nordisk op de Deense beurs - het noteert bijv. ook in de VS - is sinds de dag van de Brexit met 15% gestegen. Een pak meer dan andere aandelen. Het is de marktleider in bestrijding van diabetes. Dat is ook de kernactiviteit ervan.
Novo Nordisk heeft nu ook een medicament 'Saxenda' dat overgewicht bestrijdt. Lees vandaag mee op seekingalpha.com en een paar 'willekeurige' grafiekjesUmi schreef:
De "grotere" concurrenten zijn vooral Eli Lilly & Sanofi.
Novo heeft wel veruit het grootste marktaandeel & ook 80% van hun omzet halen ze uit "diabetes care" (wat veel hoger is dan bij die andere, dus meer pure diabetes play). Het blijft wel uitkijken naar de concurrentie want deze zit niet stil.
(...)
Wat mij destijds vooral aantrok was de groei die nog in de markt zit. & feit dat het grootste deel van de patiënten uit azië komt. Een markt die de geneesmiddelen nog niet kan betalen of waar de aanpak van deze ziektes ondermaats is. Iets wat in de toekomst wel zal verbeteren & dit een nieuwe grote markt kan worden. Voorlopig komt meer dan de helft van de inkomsten uit USA.
http://www.iex.be/Column/108980/Diabete ... loeit.aspxdaarnaast bedroeg Novo zn trackrecord een groei van 20% per jaar. kan wel niet doorgezet worden vertelde de CEO vorig jaar. Beoogde groei zal minstens 10% per jaar bedragen.Wereldwijd zal het aantal mensen met diabetes, nu al meer dan 180 miljoen, de komende jaren fors toenemen. Voor 2030 houdt de Wereldgezondheidsorganisatie (WHO) zelfs rekening met 550 miljoen mensen.
(...)
Ook belangrijk worden de verkiezingen in de USA. Gaat Clinton de hoge prijzen in de Pharma aanpakken?
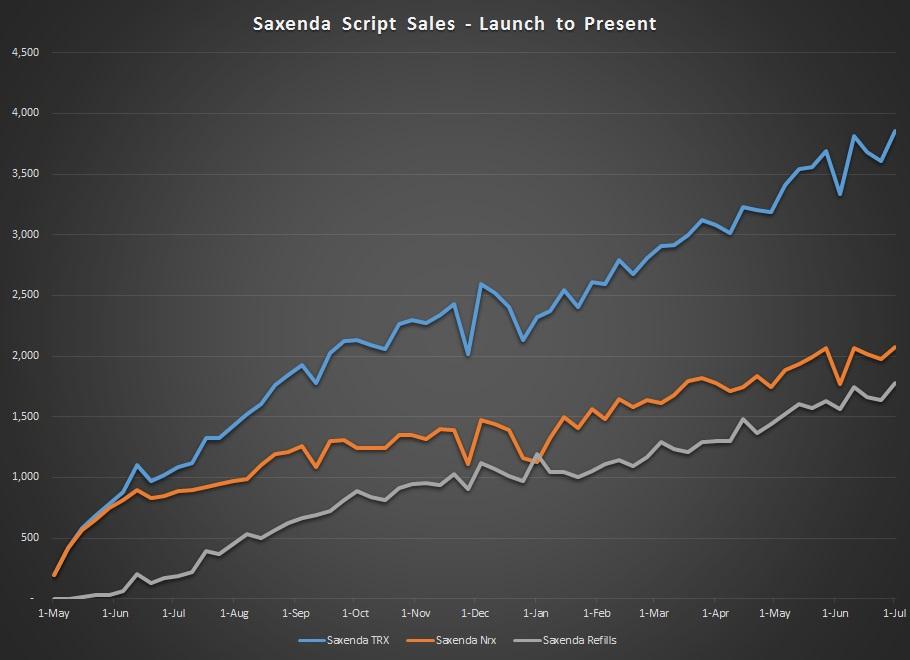
Novo Nordisk got Saxenda approval in the United States, Europe, Canada, and even Mexico in record time. Where other companies have failed in expansion at turn after turn, Novo Nordisk delivered within months. In my opinion, the company that actually has the best potential in this branded anti-obesity space is Novo Nordisk, and Saxenda. Novo has the cash to drive sales, the experience to garner approval, and the professional staff to navigate insurance and sales calls.
On a year over year basis, Saxenda is very impressive. In fairness, the launch was still very new last year. It is little wonder why, given that newness that the year over year comparison comes in showing growth of 485%. If you look at the trend lines of 2015 vs. those set in 2016, you will see that the company is still carrying forward a very steady upward trajectory.
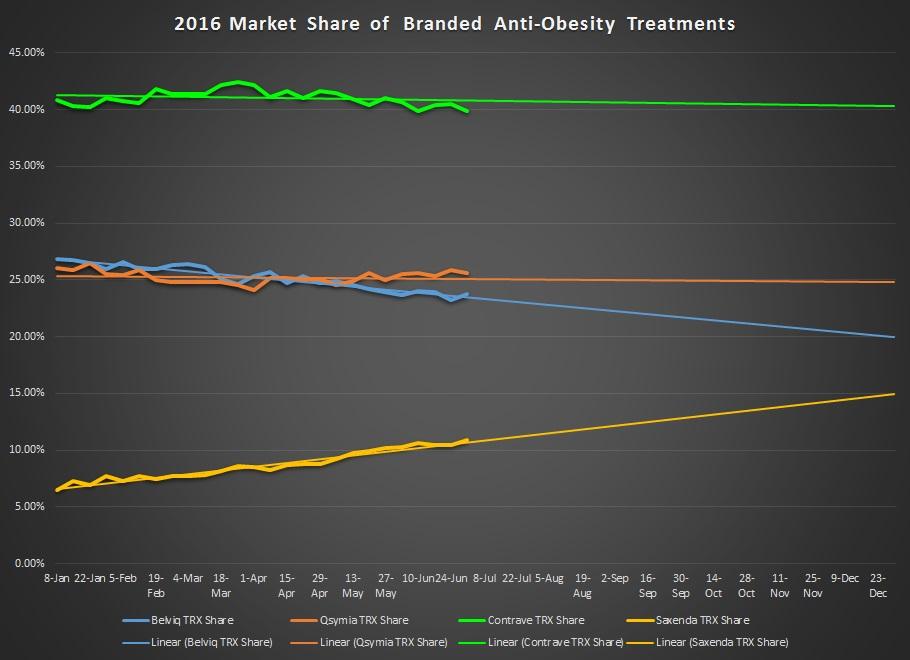
In terms of market share, Saxenda is now approaching 11%. If that number is not impressive, what may be is this. Saxenda is now the only drug in the branded anti-obesity sector that is presenting a positive market share trajectory. It is not on a path to overtake its competition by the end of the year, but it is on a path to be close to accomplishing that. Despite the lowest market share in the sector, the revenue that Novo gains is the highest in the space.
http://seekingalpha.com/article/3987426 ... trong-noteThe bottom line is this. Most people invested in Novo Nordisk do not even give a second thought to Saxenda or the anti-obesity space. What these people will soon see is that Saxenda is actually making a meaningful contribution to the revenue story of Novo Nordisk. No, Saxenda is not going to be the flagship product of the company, but it can be the drug that delivered the biggest surprise of the year. Stay Tuned!
Hier de cijfers zelf van het aandeel (van de WSJ, dus in USD):
http://quotes.wsj.com/NVO/financials
Valuation
P/E Ratio (TTM) 27.49
P/E Ratio (including extraordinary items) 27.19
Price to Sales Ratio 9.55
Price to Book Ratio 21.69
Price to Cash Flow Ratio 26.92
Enterprise Value to EBITDA 18.36
Enterprise Value to Sales 8.16
Total Debt to Enterprise Value 0.00
Total Debt to EBITDA 0.02
EPS (recurring) 15.08
EPS (basic) 13.56
EPS (diluted) 13.52
Efficiency
Revenue/Employee 2,655,815
Income Per Employee 857,818
Receivables Turnover 5.64
Total Asset Turnover 1.28
Liquidity
Current Ratio 1.35
Quick Ratio 1.04
Cash Ratio 0.51
Profitability
Gross Margin +84.55
Operating Margin +42.87
Pretax Margin +40.28
Net Margin +32.30
Return on Assets 41.29
Return on Equity 79.90
Return on Total Capital 78.29
Return on Invested Capital 79.90
Capital Structure
Total Debt to Total Equity 2.28
Total Debt to Total Capital 2.23
Total Debt to Total Assets 1.17
Interest Coverage 312.62
Long-Term Debt to Equity -
Long-Term Debt to Total Capital -
Long-Term Debt to Assets -
Per Share Data Novo Nordisk A/S ADR
All values updated annually at fiscal year end
Earnings Per Share +13.56 Sales 41.87
Tangible Book Value 17.59 Operating Profit 17.95
Working Capital 5.60 Long Term Liabilities 1.55
Capital Expenditure 2.49 Capital Expenditure TTM 2.18
@Umi, bedankt voor de info die me dit deed uitzoeken.
Iemand een oordeel? Ziet er voor mij persoonlijk een zeer duur aandeel uit, maar met volop potentieel.